[Extract from Seeing the Ocean Through the Trees, by David Carruthers, Ecotrust Canada]
1.0 Rational
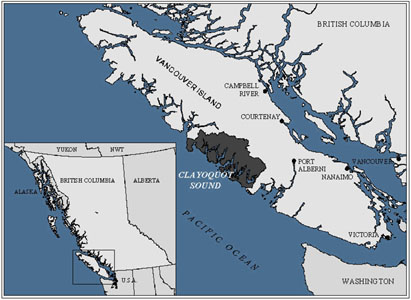
Like most groups who paid an interest to the issues in Clayoquot Sound, Ecotrust Canada applauded the final release of the Scientific Panel’s recommendations. As a matter of fact, all sectors, including industry, government, First Nations and Environmentalists, endorsed the final reports. Finally something we could all agree on. The recommendations were based on science and local values, and it looked as though, once applied, they would help resolve what many people called, “the war in the woods”.
But there was only one small catch: they hadn’t been applied, and more importantly, they hadn’t been interpreted. Many recommendations were made, such as creating reserves for the protection of old-growth interior habitat conditions, but the Scientific Panel didn’t go so far as to show where these areas were located. In fact, the Panel’s recommendations were never mapped to show how their new vision would look once applied to the land.
On January 15, 1996, Ecotrust Canada set out to do just this. Using mainly existing government-prepared data sets and advanced mapping technologies, we began to map out, for the first time, the Scientific Panel’s watershed-based recommendations. Our intentions were not to create a set of maps showing the definitive boundaries of where logging should or should not take place. Instead, our intentions were two-fold: (1) to create a base-line set of information which could be used as a bench-mark for future studies; and (2) to show at a watershed-scale, what all sectors had agreed to.
The results of this analysis were published in 1997 in Seeing the Ocean Through the Trees, a book by Ecotrust Canada on a conservation-based development strategy for Clayoquot Sound. The analysis concluded (not to give the ending away) that due to environmental and cultural constraints, there is little room in the Sound for industrial-level logging. But what is available, however, is enough to start building a viable, selective, scientifically sanctioned, and sustainable community-based logging and forest products industry in the Sound.
Of interest, the Ministry of Forests have been working on completing their $7 million inventory to map out the Panel’s recommendations. Their interpretations of the recommendations (and the data) are due to be released later this year. It will be interesting to compare this study with the work done by Ecotrust Canada, to see not only how other sectors interpret the Panel’s recommendations, but to see if in fact it was $7 million of public money well spent.
There are two ways to acquire the data used in Ecotrust Canada’s analysis of the Scientific Panel’s recommendations.
(1) You can down-load the data in Arc/Info E00 format for free from Interrain Pacific’s Bioregional Information System (BIS). Once one the BIS, search for themes that are available via FTP, with the geographic region set to British Columbia. You will then see a listing of selected data for Clayoquot Sound.
(2) You can order the data on CD ROM, shipped with viewing software (Arc Explorer), by contacting the Ecotrust Canada office by e-mail. Please note that CD’s are free to Clayoquot Sound area residents and $65 (includes GST and mailing within Canada) for non-area residents.
There are ten maps available in a variety of formats. The following maps are displayed in low resolution here. Download them to see them at a larger size. For high resolution maps, please contact Ecotrust Canada (see below). The maps are:
1. Rate-of-Cut Classifications
2. Reserve to Protect Hydroriparian Resources
3. Reserve to Protect Sensitive Soils and Unstable Terrain
4. Reserves to protect forest-interior conditions in late successional forests
5. Reserves to protect cultural values
6. Reserves to protect scenic and recreational values
7. Reserve to ensure links among watershed-planning areas
8. Existing Protected Areas
9. Combined reserves and protected areas
10. Combined reserves, existing protected areas and pristine watersheds
You can acquire a copy of these maps in four formats:
(1) Individual 11″ X 17″ maps ($11.50 each)
(2) Full poster 36″ X 48″ of all the maps with photos and description of the analysis and recommendations ($55)
(3) Acquire a copy of the book Seeing the Oceans Through the Trees, which showcases the maps in colour ($20)
(4) Acquire a copy of the maps in TIF file format on CD-ROM ($65)
A 15% discounts is available for First Nations and academic institutions.
Please send your requests by e-mail or by regular mail to Ecotrust Canada.
The Scientific Panel wanted the flow of forest products from Clayoquot Sound to be dictated by the local environment, instead of being driven by an imposed quota system governed by an annual allowable cut. In order to achieve this, the panel recommended that at the watershed level, maps should be made which designate the reserves of sensitive areas where no harvesting should occur. The idea here is that once highly valued and sensitive areas are set aside, cut-block plans can then be developed on what remains.
 The analysis involved in such a study is known as constraint mapping. Ecotrust Canada, at their mapping office in Victoria, conducted a constraint mapping exercise by bringing together a variety of spatial information, filtering out watersheds that have been over-harvested, areas that are environmentally sensitive or highly valued for cultural reasons, and areas that are currently set aside for protection, such as provincial parks. This process followed the principles outlined in the Scientific Panel’s watershed-based recommendations.
The maps created by Ecotrust Canada should be viewed as a progression – a set of filters which build to the final constraints map (Figure 1). By overlaying each constraint, one by one, it is possible to build a composite progression that identifies areas which should be set aside from development. This mapping exercise relied on the scientific panel’s own definitions and used as a basis for the analysis many government prepared data sets. The final map takes recommendations from the scientific panel’s report and applies them, for the first time, to the land.
The scientific panel adopted an ecosystem based approach to landscape planning. Recognizing that administrative boundaries do not coincide with ecosystem boundaries, the panel recommended that physiographic or ecological land units be used in land use planning and resource management. With this in mind, four scales of planning were identified: (1) regional; (2) subregional; (3) watershed; and (4) the site-level planning scale.
Regional and sub-regional plans assist in identifying general use areas, assessing the cumulative distribution of resources and ensuring consistency among lower-level plans. Site level plans are generally implementation plans, such as studies confirming boundaries of harvestable areas and specific locations acceptable for resource extraction. The panel identified the watershed scale as the basic unit for planning and management in Clayoquot Sound, the scale at which plans are developed to help guide all land-based activities.
At the watershed level, the first constraint to be mapped is the panel’s rate-of-cut (ROC) recommendations. The analysis determines if a watershed should be temporarily removed from the forest land base due to past cutting which has extracted too much, too fast. A second series of constraints involves areas that should be removed from the forest land base due to their sensitivity and high biological or cultural values. The third constraint to be mapped is existing protected areas in Clayoquot Sound. Once combined, these three constraints illustrate the total land area where no harvesting should occur, and conversely, areas where sustainable harvesting could take place.
4.0 First Constraint: Rate-of-Cut Recommendation
 The underlying principle in this recommendation is that no more than 5 per cent of a watershed area should be cut within a 5-year period. This applies to watersheds which are larger than 500 hectares. For primary watersheds (watersheds which drain directly into the ocean), the rate is limited to no more than 10 per cent within a 10-year period. Regardless of watershed size, if the ROC exceeds 5 per cent in the past 5 years, but is less than 20 per cent in the past 10-years, a watershed sensitivity analysis and stream channel audit must be completed. In those cases where the ROC exceeds 20 per cent, no further harvesting is permitted until the ROC returns to the acceptable level. Using forest cover information and watershed boundaries, Map 1 illustrates pristine watersheds, watersheds which conform to the ROC, watersheds where a sensitivity analysis and stream channel audit must be completed, and watersheds which should be temporarily removed from the forest base due to cutting which has exceeded 20 per cent of the total watershed area.
5.0 Second Constraint: Reserves to Protect Sensitive and Highly Valued Areas
Eight types of reserves were identified by the scientific panel to protect sensitive and highly valued areas. These reserves were recommended to protect: (1) hydroriparian resources (i.e. areas adjacent to water); (2) sensitive soils and unstable terrain; (3) habitat for red- and blue-listed plant and animal species; (4) forest-interior conditions in old-growth forests; (5) important cultural values; (6) areas with high scenic and recreation values; (7) an equal representation of all ecosystems; and (8) links among watershed-level planning areas.
5.1 Reserve 1: Hydroriparian Resources
 Using a complex stream classification system, the panel suggested specific reserve designations for specific hydrological resources. Here, the panel builds on existing recommendations found in the Forest Practices Code and associated guidebooks, such as the Gully Assessment Procedures for British Columbia Forests. At the watershed level, streams area classified according to their slope, and given a corresponding reserve buffer size. For example, streams with a gradient less than 8 per cent, according to the scientific panel, should be allocated a reserve buffer of 50 meters. Map 2 illustrates these reserves. The panel states that these reserves should be excluded from all harvesting activities.
5.2 Reserve 2: Sensitive Soils and Unstable Terrain
 The panel states that only stable terrain and resilient soils should be made available for forest harvesting operations. Due to the fact that detailed soil maps were unavailable at the time of this study, only slopes were examined in this analysis. Referring to the Forest Practices Code guidebook, Mapping and Assessing Terrain Stability, the panel adopted a methodology to determine slope stability at a site-specific scale. Stepping back to the scientific panel’s recommended study scale, the watershed unit, the guidebook makes general recommendations that slopes in excess of 60 per cent (31 degrees) are usually too steep for forest activities, and slopes in excess of 70 per cent (35 degrees) are almost certainly too unstable for forest activities. Using a digital elevation model of the Sound, Map 3 illustrates slopes which are steeper than 70 per cent, a conservative approach to determining reserves that will protect potentially unstable terrain.
5.3 Reserve 3: Reserves to Protect Red- and Blue-listed Plant and Animal Species
The scientific panel has followed the general shift in conservation management away from a species approach to protection, to the preservation of habitats and home ranges of rare or endangered species. The panel recommends that reserves be created for the habitat protection of red- and blue-listed (endangered and threatened) plant and animal species (table 2). Recognizing that protection is often better implemented at the site-specific scale, and that planning for protection may occur at the subregional scale, maps can be created at the watershed level to help define the boundaries of this reserve designation. Unfortunately, mapping this recommendation is hampered by a lack of habitat information for threatened, endangered, or rare species in Clayoquot Sound. Due to this limitation, this reserve is not included in our set of constraint maps.
| TABLE 2 Red and Blue listed plant and animal species observed in the Clayoquot Sound Area (BCCDB, 1996) | |||
| TYPE | SCIENTIFIC NAME | COMMON NAME | RANK |
| Vascular Plant | Carex pansa | Sand-Dune Sedge | Blue |
| Vascular Plant | Aster paucicapitatus | Olympic Mountain Aster | Blue |
| Vascular Plant | Erysimum arenicola var torulosum | Sand-Dwelling Wallflower | Blue |
| Vascular Plant | Hedysarum occidentale | Western Hedysarum | Blue |
| Vascular Plant | Epilobium glaberrimum ssp fastigiatum | Smooth Willowherb | Blue |
| Vascular Plant | Asplenium adulterinum | Corrupt Spleenwort | Blue |
| Vascular Plant | Romanzoffia tracyi | Tracy’s Romanzoffia | Blue |
| Vascular Plant | Myrica californica | California Wax-Myrtle | Blue |
| Vascular Plant | Fraxinus latifolia | Oregon Ash | Red |
| Vascular Plant | Scrophularia lanceolata | Lance-Leaved Figwort | Blue |
| Vascular Plant | Juncus brevicaudatus | Short-Tailed Rush | Blue |
| Vascular Plant | Utricularia gibba | Humped Bladderwort | Blue |
| Vascular Plant | Thelypteris quelpaertensis | Mountain Fern | Blue |
| Vertebrate | Ptychoramphus aleuticus | Cassin’s Auklet | Blue |
| Vertebrate | Fratercula cirrhata | Tufted Puffin | Blue |
| Vertebrate | Melanitta perspicillata | Surf Scoter | Blue |
| Vertebrate | Haliaeetus leucocephalus | Bald Eagle | Blue |
| Vertebrate | Gulo gulo vancouverensis | Vancouver Island Wolverine | Red |
| Note: Red = Endangered; Blue = Threatened | |||
5.4 Reserve 4: Reserves to protect forest-interior conditions in late successional forests
 The scientific panel has recognized that many plants and animals rely on the unique interior conditions of older forests for their survival. The panel stated that, assuming tree heights of 50 m, a reserve width of 300 m will provide at least some forest-interior conditions for these species (Figure 4). Using satellite imagery at a 30 m resolution, older intact forests have been mapped, along with a 300 m interior reserve buffer, and illustrated in Map 4.
The Panel notes that the total area reserved in each watershed should not be less than 40 per cent of the total watershed area, and the actual interior area should not be less than 20 per cent of the total area.5
5.5 Reserve 5: Reserves to protect cultural values
 People and local cultures must be considered in any environmental planning exercise. The scientific panel has identified the need to create reserves to protect culturally important areas, including sacred areas, historic sites, and traditional and current land use areas. Maps have been created for the provincial archeology branch to show the extent of known and potential archaeological and current indigenous use areas. These data are illustrated in Map 5. This map is a good starting point in mapping culturally important sites. However, the scientific panel’s intent in creating these reserves was to protect only areas identified by the Nuu-chah-nulth First Nations, and thus this map does not include areas of cultural importance to non-aboriginal people living in the Sound. Further inventories and consultation are required from the Nuu-chah-nulth, and other residents in the sound.
5.6 Reserve 6: Reserves to protect scenic and recreational values
 Although difficult to quantify, the panel recommended that areas with high scenic and recreational values should be protected from alteration. The Ministry of Tourism has conducted a detailed scenic corridors analysis of the Sound6, complemented by maps of recreational use areas. These maps illustrate highly visible areas which have not been altered, areas visible from communities, important recreational sites, and areas with a strong recreational focus, such as hiking trails and popular kayaking routes. Combined, these areas are presented in Map 6.
5.7 Reserve 7: Reserves to protect all ecosystems
The scientific panel recommended that all of the above reserves, combined with existing protected areas, be overlayed onto one map to determine if all ecosystems are being equally protected. This investigation can be carried out by calculating the percentage of each biogeoclimatic site series (or surrogate) classification protected by the reserves. The panel recommended that, where ecosystems are found to be under-represented, reserves should be created to ensure their proportional protection. In order to carry out this analysis, terrestrial ecosystem maps are required, but are unavailable. Due to this limitation this reserve is not included in our constraint mapping analysis.
5.8 Reserve 8: Reserves to ensure links among watershed-planning areas
 This reserve designation was suggested by the panel to ensure that all of the reserves are adequately linked together to maximize the migration of animals and plants between units, and to provide connectivity for recreational opportunities. The mapping for this reserve has been done by visual inspection of the combined reserve designations and is illustrated in Map 7. Gaps between large reserve areas and between recreational use areas, such as between trails and camping areas, are joined together by the creation of this final reserve designation.
6.0 Third Constraint: Existing Protected Areas
 The Ministry of Forests has produced a watershed map which defines the boundaries of Clayoquot Sound7. The total land area of the Sound, excluding Meares Island and Tofino, is 254,726.04 hectares. Of this total land base, 34.87 per cent (88,821.66 ha) is protected either provincially or federally. Existing protected areas are illustrated in Map 8, and comprise the third constraint in the scientific panel mapping exercise.
 By combining all of the previous eight maps, a final constraints map is made to show all the areas in the Sound where logging should not occur and areas where sustainable forestry, based on the scientific panel’s recommendations, can potentially take place (Map 9).
From Map 9, analysis shows that 22,916.31 ha of the Sound is potentially available for the creation of forest development plans (Table 4).
| Table 4 Summary table of the constraints to logging by area | |||
|
|
|
|
|
| 1 | Rate-of-cut (watersheds which exceed the ROC) | 58613.15 | 23.01 |
| 2 | Reserves to protect hydroriparian resources | 51769.73 | 20.32 |
| 3 | Reserves to protect sensitive soils and unstable terrain | 70488.5 | 27.67 |
| 4 | Reserves to protect forest-interior conditions | 104155.09 | 40.89 |
| 5 | Reserves to protect cultural values | 43788.84 | 17.19 |
| 6 | Reserves to protect scenic and recreational values | 61813.10 | 24.27 |
| 7 | Reserves to ensure links among watershed-planning areas | 31182.32 | 12.27 |
| 8 | Existing protected areas | 88821.66 | 34.87 |
| 9 | Final constraints map | 231809.18 | 91.00 |
| 10 | Final constraints map and pristine watersheds | 243941.66 | 95.77 |
8.0 Combined Constraints Map and Pristine Watersheds
 As described on pages 33-34, pristine watersheds are inherently important for economic, cultural and environmental reasons. While the scientific panel’s recommendations have gained acceptance, one important critique of the panel’s work is that it made no specific recommendations regarding pristine areas. There remains a widespread and well justified belief that the remaining untouched watersheds in Clayoquot should be protected from development. Map 10 combines Map 9, the final constraints map, with a further constraint against logging in pristine valleys. Map 9 suggests the amount of land that can actually be logged in the Sound amounts to 22,916.31 hectares. Map 10 shows the location of the 10,784.11 hectares of land available for logging if the pristine watersheds are protected, and the recommendations of the scientific panel are followed across the entire land base of Clayoquot Sound.

The results of this analysis were published in 1997 in Seeing the Ocean Through the Trees, a book by Ecotrust Canada on a conservation-based development strategy for Clayoquot Sound. The analysis concluded (not to give the ending away) that due to environmental and cultural constraints, there is little room in the Sound for industrial-level logging. But what is available, however, is enough to start building a viable, selective, scientifically sanctioned, and sustainable community-based logging and forest products industry in the Sound.
 Scientific Panel’s Final Report |
 Ecotrust Canada’s Seeing the Ocean Through the Trees |
5 Scientific panel, op. Cit., 170.
6 Clayoquot Landscape Inventory, Phase 2: Final Report. Juan de Fuca Environmental Consultants, Clayoquot Sound Scenic Corridors Planning Process, Ministry of Small Business, Tourism and Culture, 1994 (unpublished).
7 Clayoquot Sound Watershed Groups, 1:200,000 map. Allan Chapman, Ministry of Forest, Vancouver Forest Region, 1996 (unpublished).