A New Way to Look at Maps. Every day we are surrounded by a multitude of maps: street maps, political maps, world maps, geophysical maps, and so on. Maps are powerful images which embody a seemingly incontestable truth – rarely do we challenge what we see presented there. Further, the creation of maps is seen to be the exclusive realm of ‘experts’ who use complex technologies to produce them. Bioregional mapping, however, provides an alternative way of thinking about map production and use. Whereas mainstream mapping depends on expert cartographers, bioregional mapping is done by ordinary citizens who rediscover local places through their map-making explorations.
The Methods are Simple. The production of bioregional maps is not dependent on expensive computers and does not require years of formal training. It simply requires a curiosity and a willingness to learn about home places (and some paper, some scissors, some glue and a photocopier).
1. A boundary is defined for the mapping exercise. This area can be very large, such as the ‘Cascadia bioregion’ stretching from northern California to the Alaska Panhandle, or it can be very small, like a parcel of land or a city neighbourhood. In many instances, the area’s boundaries will mirror natural features, such as watersheds and mountain ridges. These borders are meaningful in that they are often indicative of ecosystem boundaries, biogeoclimatic zones, and the traditional territories of aboriginal peoples. Such boundaries make sense within our physical environment and help us develop a home place that is less artificial than that defined by arbitrary geopolitical borders.
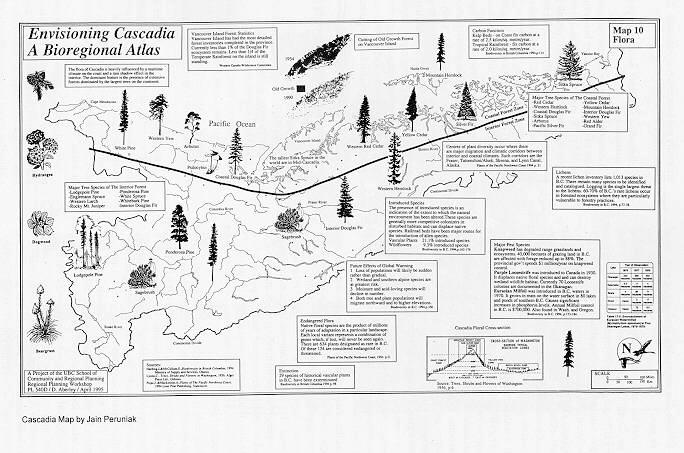 |
“Flora” from the UBC SCARP Cascadia bioregional atlas. Map by Jain Peruniak. Reproduced from Giving the Land a Voice. |
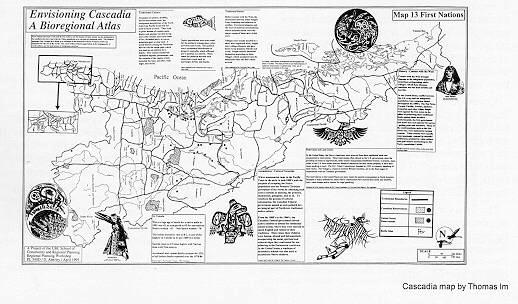 |
“First Nations” from the UBC SCARP Cascadia bioregional atlas. Map by Jain Peruniak. Reproduced from Giving the Land a Voice. |
2. A basemap is created. The central element will obviously be the bioregion. This can be traced from a formal physiographic map or drawn freehand. A standard map scale (such as 1:50,000 or 1:250,000) facilitates copying from existing maps. Ideally, one should include certain physical elements on the map, such as major rivers, mountains, and so on. A graphical scale (so that the map can be reduced or enlarged while the scale stays relative), a north arrow and a title box should also be on the basemap.
3. Topics to be mapped are brainstormed. Interested folks come together and decide what is meaningful in their home place. Map topics might include:
- Geology
- Weather
- Agriculture
- Natural resources
- Wildlife habitats
- Traditional First Nations territories
- Wetlands
- Administrative boundaries
- Archaeological sites
- Health concerns
- Environmental degradation
- Transportation
4. The basemap is reproduced and bioregional map-making begins! The mapmaker(s) research their topics and begin to conceptualize their maps. Places to look are unlimited. You can study formal maps, visit real-world places, browse the Internet, talk to elders, peruse local archives, explore libraries, interview people, take photographs, and so on. The information is then distilled and applied to the basemap. The most important thing to keep in mind is that you are trying to tell a story – try and keep your map clear and easy to understand. Apply your information to the basemap as textboxes, shading, arrows, drawings, charts, photographs and cartoons using scissors and glue, or draw directly on the basemap. Keep things in black and white so that your maps can be copied easily.
5. Reproduce your maps using a photocopier and begin to use/distribute them. You might also want to make slides of them for presentations in meetings, or, if you have the resources, digitize them into a computer.
6. Use your maps. As mentioned above, maps are powerful tools. They can be used by a community for self-empowerment and to (re)develop a sense of place and a connection to the land. They can be tools of resistance, of education or of identity. They can be presented and distributed through schools, community meetings, museums, libraries and so on.
From Giving the Land a Voice:
“The atlas should be used as a jumping off place for decision making about the future. From the wholistic image of place that the maps collectively communicate, what actions could be adopted to achieve sustainable prosperity? What priorities emerge from a survey of damaged lands and unsolved social ills? What underutilized potentials can be put to work to help achieve sustainability? The atlas can become a focus for discussions setting a proactive plan for positive change.”
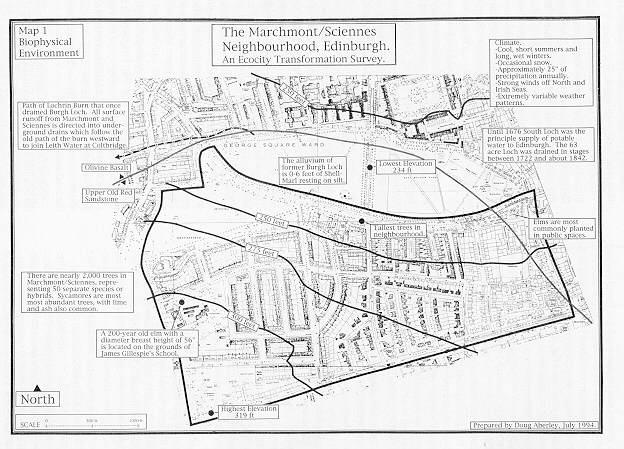 |
Doug Aberley’s map of Edinburgh, 1994. Reproduced from Giving the Land a Voice. |
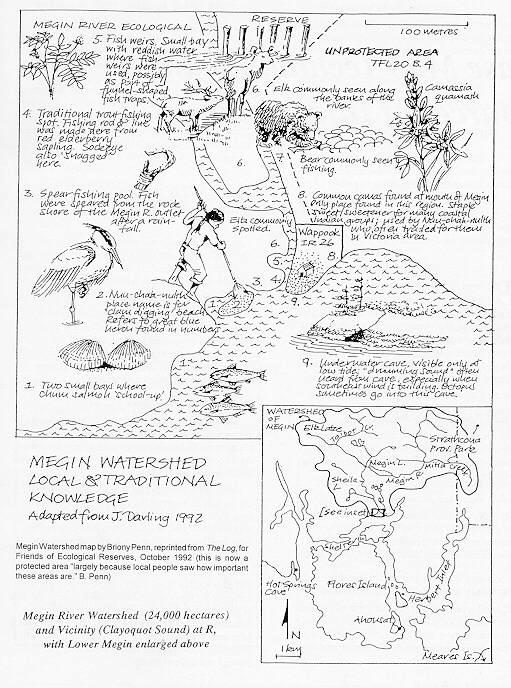 |
Megin Watershed Local and Traditional Knowledge. From Giving the Land a Voice. |
An Example. In the Spring of 1998, 17 students from the School of Community and Regional Planning at the University of British Columbia and an activist group called the Barefoot Cartographers created a bioregional atlas. The subject was Salmonopolis, an area defined by the lower Fraser basin, bounded by Mount Garibaldi to the north, Hope to the east, the Straight of Georgia to the west and Bellingham, WA., to the south. The Barefoot Cartographers created a basemap of the bioregion at a scale of 1:250,000 on sheets roughly 3 ½ by 2 ½ feet. On these basemaps, the students created 51 bioregional maps. Some of the map subjects were:
- Bedrock Geology
- Floodplains
- Watersheds
- Climate
- First Nations – Distribution
- First Nations – Land Claims Issues
- Suburbanization
- History 1985-Present
- Environmental Hotspots
- Natural Resource Economy
- Solid Waste Management
- Food Security
- Marine Ecosystems
- Culture
- Health Issues
- Public Transportation
- Informal Economy
- Wildlife Corridors
The atlas of the Salmonopolis Bioregion was formally presented at the Earth Day celebrations in Vancouver in April. In addition, the project has received attention from the media, including a front page story in the Vancouver Courier and a segment on VTV’s Breakfast Show. The intention is to present the atlas as much as possible and to have reduced-in-size versions available to schools, libraries and community groups.
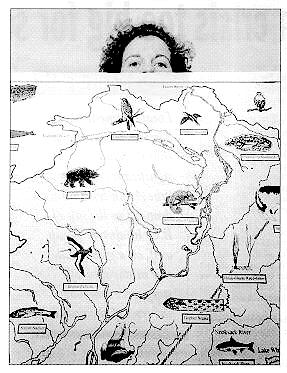 |
Kim Carr, a UBC planning student showing her map of wildlife from the Salmonopolis Bioregional Atlas. Photo by Ben Johnson. |
|
|
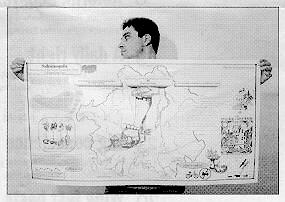
Maged Senbel and his ecological footprint map from the Salmonopolis Bioregional Atlas. Photo by Ben Johnson. |
For more information on the Salmonopolis project, contact Doug Aberley at the UBC School of Planning: daberley@unixg.ubc.ca
For Further Reading:
Aberley, Doug (ed.) 1993. Boundaries of Home: Mapping for Local Empowerment. Gabriola Island, BC: New Catalyst.
Andruss, Van, Chistopher Plant, Judith Plant, Eleanor Wright (eds). 1990. Home! A Bioregional Reader. Philadelphia: New Society Publishers.
Harrington, Sheila. Giving the Land a Voice: Mapping Our Home Places. Salt Spring Island: Salt Spring Island Community Services.
McHarg, Ian. 1969. Design With Nature. Garden City, New York: Doubleday.
Sale, Kirkpatrick. 1985. Dwellers in the Land: the Bioregional Vision. Philadelphia, PA, and Gabriola Island, BC: New Society Publishers.